Subtotal $0.00

This series of tutorials demonstrates how you can set up a Logging Pipeline using Apache Kafka and the ELK stack. MuleSoft’s logging setup via Any Point Platform contrasts with Kafka’s logging, which offers robust handling of high-volume data with fault tolerance and scalability. Elasticsearch is preferred for log analysis due to its effectiveness in aggregating and analyzing dispersed application-generated data from multiple sources.
In this series, let’s learn together the key points of installing and deploying the logging pipeline — on your operating system, covering most of the required aspects as expected for a production-ready environment:
- Setup and Installation of Apache Kafka and Zookeeper
- Setup and Installation of Elasticsearch
- Setup and Installation of Kibana
- Setup and Installation of Logstash

Installing Apache Kafka and Zookeeper
- Install Apache Kafka: https://kafka.apache.org/downloads
Let’s proceed with the installation of Apache Kafka
- Extract the downloaded archive:
tar -xvzf ~/Downloads/kafka_x.xx-x.x.x.zip - Start the Kafka environment (default port: 9092):
- Open a terminal and navigate to your Kafka directory and start Zookeeper:
./bin/zookeeper-server-start.sh config/zookeeper.properties - In a new terminal window, navigate to the Kafka directory and start the Kafka server:
./bin/kafka-server-start.sh config/server.properties
- Open a terminal and navigate to your Kafka directory and start Zookeeper:
Let’s proceed with the verification of Apache Kafka
To verify that Kafka is running correctly, create a topic and then produce and consume a message:
- Creation of Topic:
./bin/kafka-topics.sh --create --topic test --bootstrap-server localhost:9092 --replication-factor 1 --partitions 1 - Once the topic is created successfully:
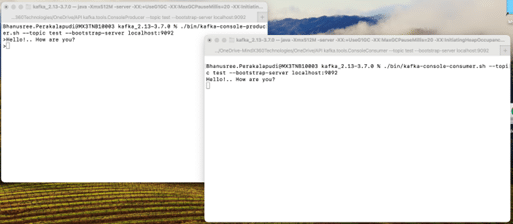
- Produce a message:
./bin/kafka-console-producer.sh --topic test --bootstrap-server localhost:9092 - Consume a message:
./bin/kafka-console-consumer.sh --topic test --bootstrap-server localhost:9092
- Produce a message:
- You should see the message you produced in the consumer terminal.
Let’s proceed with configuring Mule with Apache Kafka
- Configure Kafka properties in
log4j2.xmlfile in your Mule 4 application to write the logs to the Apache Kafka consumer window. Add the below configurations to thelog4j2.xmlfile.<Appenders> <Kafka name="Kafka" topic="test"> <JSONLayout objectMessageAsJsonObject="true"/> <Property name="bootstrap.servers">localhost:9092</Property> </Kafka> </Appenders> <AsyncRoot level="INFO"> <AppenderRef ref="file" /> <AppenderRef ref="Kafka" /> </AsyncRoot> - Copy the Kafka-clients.jar file available in the Kafka directory to the Mule server.
- Navigate to the
/libsfolder from the Kafka home directory and copy thekafka-clients-3.7.0.jarfile. - Navigate to
/AnypointStudio.app/Contents/Eclipse/plugins/org.mule.tooling.server.4.7.ee_7.18.0.202405262218/mule/lib/bootfolder from the Anypoint Studio home directory and place the copiedkafka-clients-3.7.0.jarfile as shown below:

- Navigate to the
- Run the Mule application and check whether the logs are rolling in the consumer window.


Installing Elasticsearch and Kibana
- Install Elasticsearch: elasticsearch-install-packages
- Install Kibana: https://www.elastic.co/cn/downloads/kibana
Let’s proceed with the installation of Elasticsearch
- Extract the downloaded archive:
tar -xvzf ~/Downloads/elasticsearch_x.xx.zip - Navigate to
/configfrom the root folder of Elasticsearch, open theelasticsearch.ymlfile, and update the file as mentioned below:- Uncomment the two fields:
network.host: localhosthttp.port: 9200
- Set the below fields as:
xpack.security.http.ssl: enabled: falsexpack.security.transport.ssl: enabled: false
- Uncomment the two fields:
- Start Elasticsearch and run:
.bin/elasticsearch(orbin\elasticsearch.baton Windows) - Check if your terminal displays a message similar to this after running Elasticsearch:
ℹ️  Password for the elastic user (reset with `bin/elasticsearch-reset-password -u elastic`):
  i*uO*VgyXIpbPycLE_z0
ℹ️  HTTP CA certificate SHA-256 fingerprint:
  ac07338bbfb65022a95d23e31d98ecaa8d6574b93f42d8ee1da243e7575a84d3

ℹ️  Configure Kibana to use this cluster:
• Run Kibana and click the configuration link in the terminal when Kibana starts.
• Copy the following enrollment token and paste it into Kibana in your browser (valid for the next 30 minutes):
  eyJ2ZXIiOiI4LjE0LjAiLCJhZHIiOlsiMTAuNTAuOTMuMjIwOjkyMDAiXSwiZmdyIjoiYWMwNzMzOGJiZmI2NTAyMmE5NWQyM2UzMWQ5OGVjYWE4ZDY1NzRiOTNmNDJkOGVlMWRhMjQzZTc1NzVhODRkMyIsImtleSI6IjFCME1LcEFCekZFTU9NTzNDcV9kOi1zRWdjZkZpVC1pS2dWeUM1QTBDTkEifQ==

ℹ️  Configure other nodes to join this cluster:
• On this node:
  ⁃ Create an enrollment token with `bin/elasticsearch-create-enrollment-token -s node`.
  ⁃ Uncomment the transport.host setting at the end of config/elasticsearch.yml.
  ⁃ Restart Elasticsearch.
• On other nodes:
  ⁃ Start Elasticsearch with `bin/elasticsearch --enrollment-token `, using the enrollment token that you generated.
Let’s proceed with the verification of Elasticsearch
To verify that Elasticsearch is up and running correctly:
- Try to access the Elasticsearch URL (i.e.,
http://localhost:9200) from your browser and check the health of Elasticsearch.

Similarly, Let’s proceed with the installation of Kibana
- Extract the downloaded archive:
tar -xvzf ~/Downloads/kibana_x.xx.zip - Start Elasticsearch and run:
.bin/elasticsearch(orbin\elasticsearch.baton Windows)
Let’s proceed with the verification of the Kibana setup also
To verify that Kibana is up and running correctly:
- Click on the link provided in the terminal or point your browser at
http://localhost:5601
Let’s connect to elastic search
- Log in to Elasticsearch on your browser
http://localhost:5601 - Use the Elasticsearch credentials to login to the homepage of Elasticsearch.
- Once login is successful, give the token generated from Elasticsearch to connect with Kibana as shown below:
- On successful validation of token, you can access the homepage of Elasticsearch as shown below:

Installing Logstash
To connect Mule to the Kafka server and Elasticsearch, we are using Logstash.
- Install Logstash: https://www.elastic.co/downloads/logstash
Let’s proceed with the installation of Logstash
- Extract the downloaded archive:
tar -xvzf ~/Downloads/logstash_x.xx.zip - Navigate to
/configfrom the root folder of Logstash, and create a.conffile to connect to Elasticsearch. - Update/Create the
test.conffile as mentioned below:input { kafka { bootstrap_servers => "localhost:9092" topics => "test" codec => "plain" } } filter { grok { match => { message => "%{GREEDYDATA:json_message}" } overwrite => ["message"] } json { source => "json_message" target => "parsed_json" } date { match => ["[parsed_json][message][timestamp]", "ISO8601"] target => "@timestamp" } mutate { remove_field => ["json_message"] } } output { elasticsearch { hosts => ["localhost:9200"] user => "elastic" password => "i*uO*VgyXIpbPycLE_z0" ilm_rollover_alias => "mule-logs" codec => "plain" } } - Navigate to the root folder of Logstash and run the
test.conffile created using the below command:./bin/logstash -f /*path of logstash folder*/logstash-8.12.0/config/test.conf
Let’s proceed with the verification of Logstash
- MuleSoft test application logs should roll on the terminal window.
- Also, point your browser at
http://localhost:5601and log in to Elasticsearch to check for the logs.

Creating indexes in Elasticsearch
- Login to Elasticsearch with the appropriate user credentials.
- Navigate to the Discover dashboard.
- Click on “Create a data view” as shown below.
- Fill in the Name and Index-pattern fields and click on the “Save data view to Kibana” button.
- You should be able to view the logs from the dashboard section.
- You have successfully established the connection between MuleSoft
log4j2and Elasticsearch.


Comments are closed